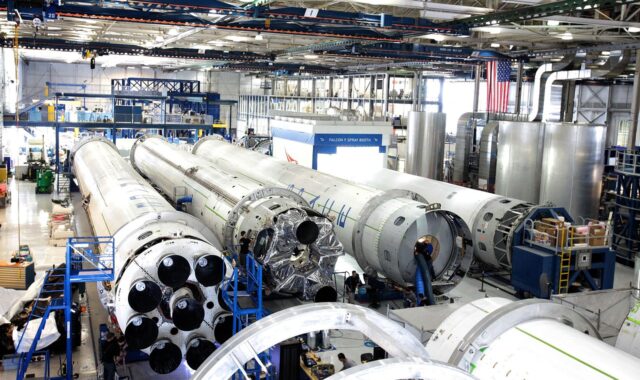
Manufacturing production explained with metrics, methods, and 2026 data signals
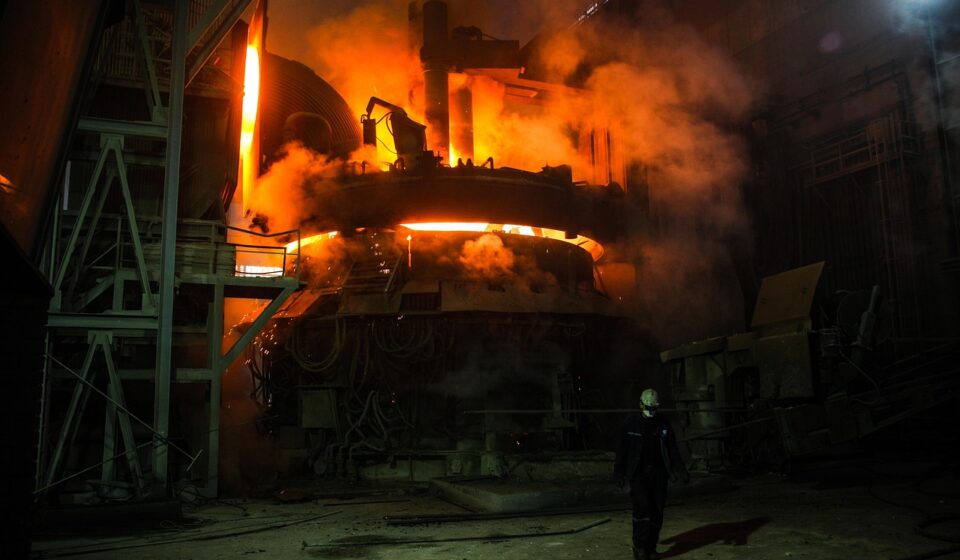
What manufacturing production means in practical terms
Manufacturing production is the planned conversion of raw materials, purchased components, labor, machine capacity, energy, and production information into saleable goods. It is more than running equipment. A complete production system connects demand, engineering data, process routing, quality control, maintenance, inventory, workforce scheduling, and shipment timing.
For manufacturers, the central question is not simply how much a plant can produce. The output also needs to be repeatable, cost-effective, traceable, and aligned with customer requirements. In 2026, that distinction matters because production data, orders, capacity utilization, labor productivity, and inventory signals are not moving in one clear direction. Managers need to read several indicators together rather than rely on one headline number.
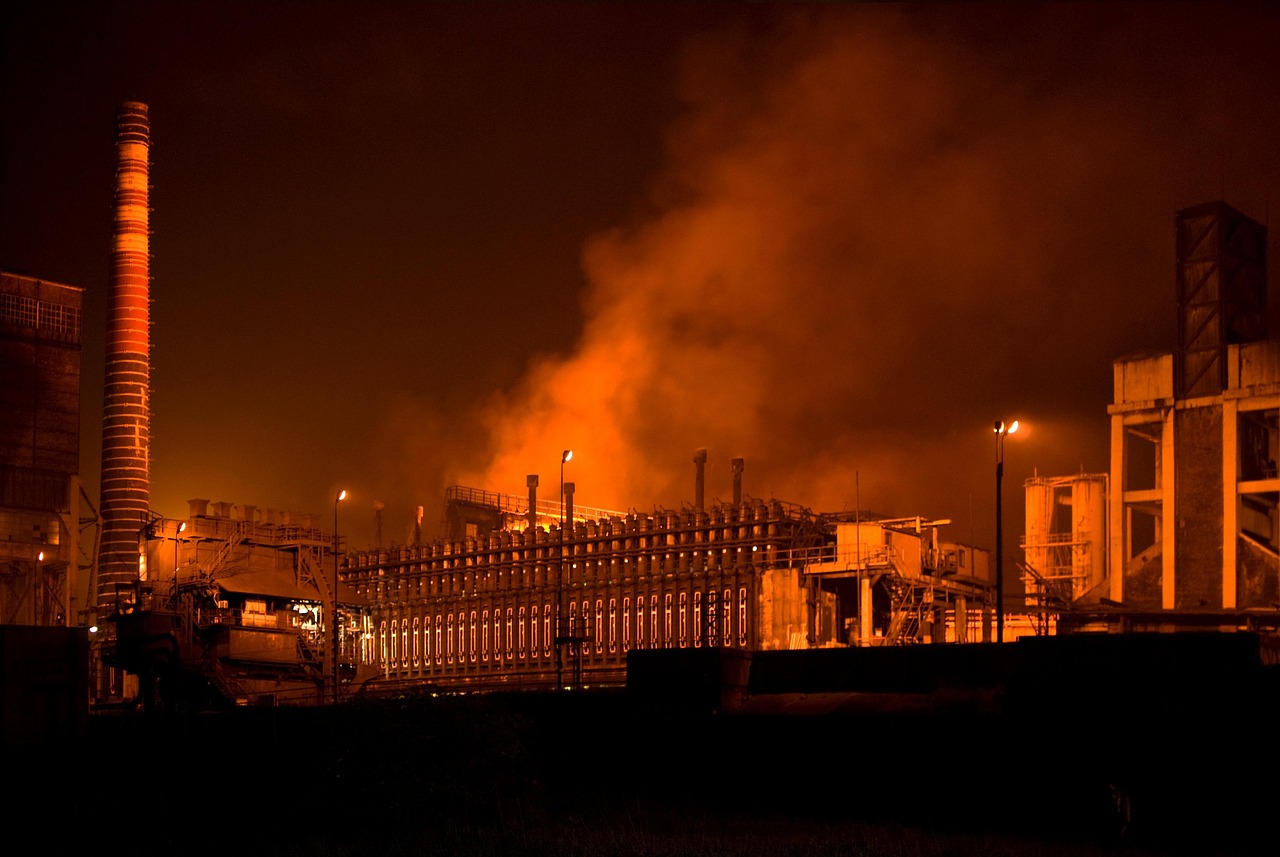
For readers comparing process types, capacity planning, or factory performance methods, this guide sits within the broader topic of manufacturing processes and focuses specifically on how production is organized, measured, and improved.
How manufacturing production turns demand into output
At the factory level, manufacturing production usually starts with demand. That demand may come from firm customer orders, forecasts, distributor replenishment signals, engineering projects, or safety-stock policies. Production planning converts it into a build plan: what to make, how much to make, when to make it, which materials are required, and which machines, tools, operators, and inspections are needed.
A typical production flow includes five connected activities:
- Product and process definition: drawings, bills of materials, routings, tolerances, work instructions, tooling requirements, and quality standards.
- Material planning: purchasing, supplier scheduling, receiving inspection, inventory availability, and substitution controls.
- Capacity scheduling: machine hours, labor skills, changeover windows, preventive maintenance, bottleneck resources, and shift patterns.
- Execution and control: work orders, machine programs, in-process inspection, scrap reporting, rework controls, and production counts.
- Release and delivery: final inspection, packaging, traceability records, shipment timing, and customer documentation.
Strong production systems make these steps visible. If planning promises more than the bottleneck can produce, delivery dates slip. If materials arrive late, capacity sits idle. If inspection finds defects after final assembly, rework consumes capacity that was intended for new orders. Manufacturing production therefore works as an operating system, not as a set of isolated departments.
Core metrics used to manage manufacturing production
Production managers may track dozens of measures, but the most useful metrics answer a smaller set of operating questions: are we producing the right items, at the required rate, with acceptable quality, at a sustainable cost, and without creating hidden risk?
| Metric | What it shows | Why it matters |
|---|---|---|
| Output volume | Units, tons, batches, or standard hours completed | Shows whether the plant is meeting the production plan |
| Throughput | Rate at which good product moves through the process | Helps identify bottlenecks and flow constraints |
| Capacity utilization | Actual output compared with estimated sustainable capacity | Indicates slack, tightness, and potential expansion pressure |
| Cycle time | Time required to complete a process step or order | Affects lead time, work-in-process, and customer responsiveness |
| First-pass yield | Share of units completed correctly without rework | Connects production speed with quality performance |
| Overall equipment effectiveness | Availability, performance, and quality combined | Highlights downtime, speed losses, and defect losses |
| Unit labor cost | Labor cost required to produce one unit of real output | Shows whether compensation growth is being offset by productivity |
These metrics should be read together. A plant can raise output by building inventory customers do not need. It can improve utilization while increasing overtime fatigue. It can reduce direct labor per unit while shifting more work into maintenance, engineering, or supplier quality. Good manufacturing production analysis looks beyond a single number and asks what trade-off produced the result.
Current 2026 data signals for manufacturing production
Recent U.S. data shows why manufacturers should separate production, demand, and capacity signals. The Federal Reserve reported on October 16, 2026, that industrial production increased 0.7 percent in September after a revised 0.1 percent gain in August. Manufacturing output rose 0.3 percent in September and increased at a 0.7 percent annual rate in the third quarter. The same release put manufacturing capacity utilization at 75.9 percent in September, below its 1972–2025 long-run average of 78.2 percent. (federalreserve.gov)
The industry detail is just as important. According to the Federal Reserve, durable manufacturing output rose only 0.1 percent in September, while nondurable manufacturing increased 0.4 percent. Within durables, primary metals, machinery, and electrical equipment posted gains of at least 1 percent, while motor vehicles and parts fell 3.0 percent. In the third quarter, durable manufacturing output rose at a 3.8 percent annual rate, partly supported by a 28.4 percent increase in semiconductors and related electronic components, while nondurable output fell 1.6 percent. (federalreserve.gov)
Order data gives another view of the same operating environment. The U.S. Census Bureau reported on October 2, 2026, that new orders for manufactured goods in August increased 0.1 percent to $663.5 billion after a 0.8 percent July increase. Shipments were virtually unchanged at $658.6 billion, unfilled orders increased 0.6 percent to $1,609.6 billion, and inventories increased 0.5 percent to $972.4 billion. The inventory-to-shipments ratio moved to 1.48 from 1.47 in July. (census.gov)
Labor productivity data adds a longer-term cost perspective. The Bureau of Labor Statistics reported in 2026 that labor productivity increased in 39 of 80 covered four-digit NAICS manufacturing industries in 2025, while unit labor costs increased in 71 of those 80 industries. BLS also defines unit labor costs as the labor cost required to produce one unit of output, rising when hourly compensation grows faster than productivity. (bls.gov)
Taken together, these indicators call for a cautious reading. Output can improve while utilization remains below its historical average. Orders can rise modestly while inventories also increase. Productivity can improve in some industries while labor-cost pressure persists across many others. For individual manufacturers, production planning should be based on product-family demand, bottleneck capacity, supplier risk, and margin sensitivity rather than broad manufacturing sentiment alone.
Common manufacturing production methods
Different products require different production methods. Choosing the wrong method can lock a factory into high changeover costs, weak quality control, or excessive inventory. The right fit depends on volume, variety, customization, tolerance requirements, material flow, and customer lead-time expectations.
Job shop production
Job shop production is used for low-volume, high-variety work such as custom machining, toolmaking, repair parts, prototypes, and specialized fabrication. Equipment is often grouped by function, and jobs follow different routings. The strength of this model is flexibility. The challenge is scheduling complexity, because orders may compete for the same skilled labor or bottleneck machine.
Batch production
Batch production makes a defined quantity of similar items before switching to another product. It is common in metal parts, plastics, food processing, chemicals, and components with shared setups. Batch production balances efficiency and variety, but it requires control over changeovers, lot sizing, cleaning, inspection, and work-in-process levels. See also: cnc and robotics.
Flow or line production
Flow production arranges operations in sequence so products move steadily from one step to the next. Automotive parts, appliances, electronics assemblies, and high-volume consumer goods often use line-based production. The advantage is throughput and consistency. The risk is that one weak station can slow the full line, which makes line balancing and preventive maintenance essential.
Continuous production
Continuous production is used when materials move through the process without frequent stops, as in refining, chemicals, paper, steel, and some food operations. These systems are capital intensive and depend heavily on process control, safety systems, and maintenance planning. Small deviations can create large quality, yield, or safety consequences.
How to improve manufacturing production without adding hidden risk
Improvement should begin with the constraint. If a plant improves a non-bottleneck operation, local efficiency may rise without increasing customer shipments. A practical improvement sequence is to identify the bottleneck, measure its losses, stabilize inputs, reduce avoidable downtime, improve changeovers, and protect the bottleneck from poor-quality upstream work.
Quality management is another foundation. ISO explains that ISO 9001 includes the process approach, risk-based thinking, documented information, monitoring and measurement, performance evaluation, and continual improvement. It also describes practical actions such as identifying key processes, defining responsibilities, controlling variations and errors, collecting performance data, and improving systems based on evidence. (iso.org)
Digital tools can help, but they are not a shortcut around process discipline. Manufacturing execution systems, sensors, machine connectivity, production dashboards, statistical process control, and predictive maintenance tools are most useful when data definitions are clear and operators trust the numbers. NIST describes smart connected manufacturing work as enabling manufacturers to use disparate data and advanced communications technologies to improve quality, reliability, interoperability, and efficiency in connected manufacturing systems. (nist.gov)
Cybersecurity and data integrity also become production issues as factories connect operational technology with enterprise systems. NIST notes that manufacturers increasingly connect operational technology systems to information technology systems and that many rely on industrial control systems to monitor and control machinery, production lines, and physical processes. When production depends on connected controls, cyber resilience, backup procedures, and change management are part of operational continuity, not only information security. (nccoe.nist.gov)
Manufacturers should also avoid treating automation as automatic improvement. Automation can reduce variation, improve ergonomics, and raise throughput, but only when the process is stable enough to automate. Automating a poorly understood process can make defects faster, make troubleshooting harder, and increase dependence on specialized maintenance. A better sequence is to simplify the process first, define standard work, measure baseline performance, and then automate the steps where the economic and quality case is clear.
What readers should watch next
For production planning, the most useful near-term signals are not limited to a single index. Watch new orders for demand direction, shipments for realized output, unfilled orders for backlog pressure, inventories for stock buildup, capacity utilization for slack or tightness, and labor productivity for cost absorption. The Federal Reserve also plans an annual revision to industrial production and capacity utilization on November 24, 2026, incorporating new benchmark data and methodological updates. That is a reminder that macro production data is valuable, but it is still revised and should be paired with plant-level evidence. (federalreserve.gov)
The practical conclusion is straightforward: manufacturing production performance improves when factories connect planning, process control, quality systems, workforce capability, maintenance, and data integrity. In a mixed operating environment, the strongest producers are not necessarily those chasing the highest output number every month. They are the ones that can deliver reliable output, protect margins, respond to changing demand, and understand the limits behind their own production data.
Frequently asked questions
What is manufacturing production?
Manufacturing production is the organized process of converting materials, components, labor, machine capacity, and information into finished goods. It includes planning, scheduling, production execution, inspection, maintenance, inventory control, and shipment readiness.
How is manufacturing production different from manufacturing process?
A manufacturing process is a specific method or sequence used to transform materials, such as machining, casting, welding, molding, assembly, or chemical processing. Manufacturing production is broader. It includes the full system that plans, controls, measures, and delivers output using one or more processes.
Which metric is most important for production performance?
No single metric is enough. Output, throughput, quality yield, cycle time, capacity utilization, downtime, inventory, and unit cost all show different parts of performance. The most useful metric depends on the current constraint, such as demand volatility, machine bottlenecks, labor availability, or quality losses.
Why can production rise while manufacturers still feel pressure?
Production can rise even when margins, labor costs, financing costs, supplier reliability, or inventories create pressure. A higher output number does not automatically mean stronger profitability. Managers need to compare output with demand quality, cost trends, backlog, inventory levels, and capacity constraints.